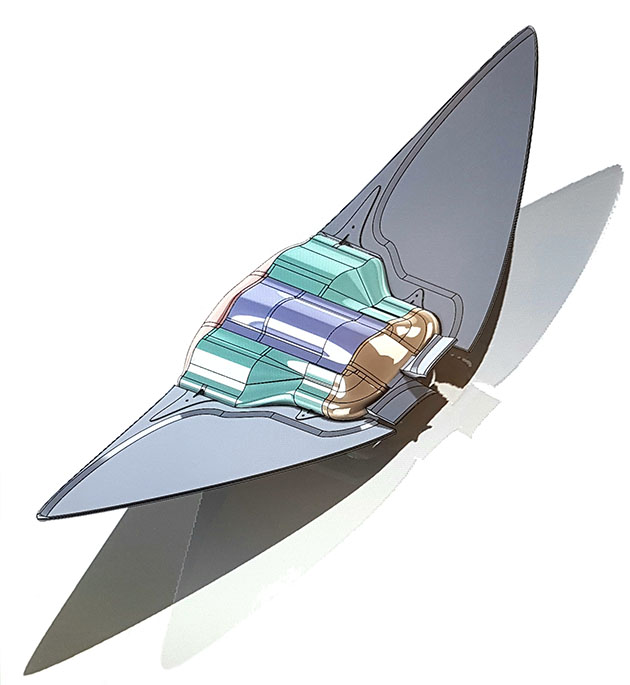
I made these models originally to avoid using mathematics. I wanted to work out how flexible springs would have to be to wriggle the tail of a fish that swam with the standard theoretical wave form. The springs would need to be off-set from the centre line of the fish and alternately pull down one side and then the other. I created the fish as a series of ‘ribs’ that were rigid and always perpendicular to the backbone. Then when the fish undulated the backbone would follow the standard formula; the ribs would have to move in turn. Then I could measure the lengths of the sides which connected the ends of the ribs. The benefit of this method is that I could use any shaped fish that I needed (actual measured or theoretical, fat or thin etc.), and I could change the number of ribs at a keystroke. Also I could ‘fix’ parts of the fish -like the head or near the tail as this is often the case for real fish where the entire head is often rigid and in the case of tuna, the neck vertebrae are fused.
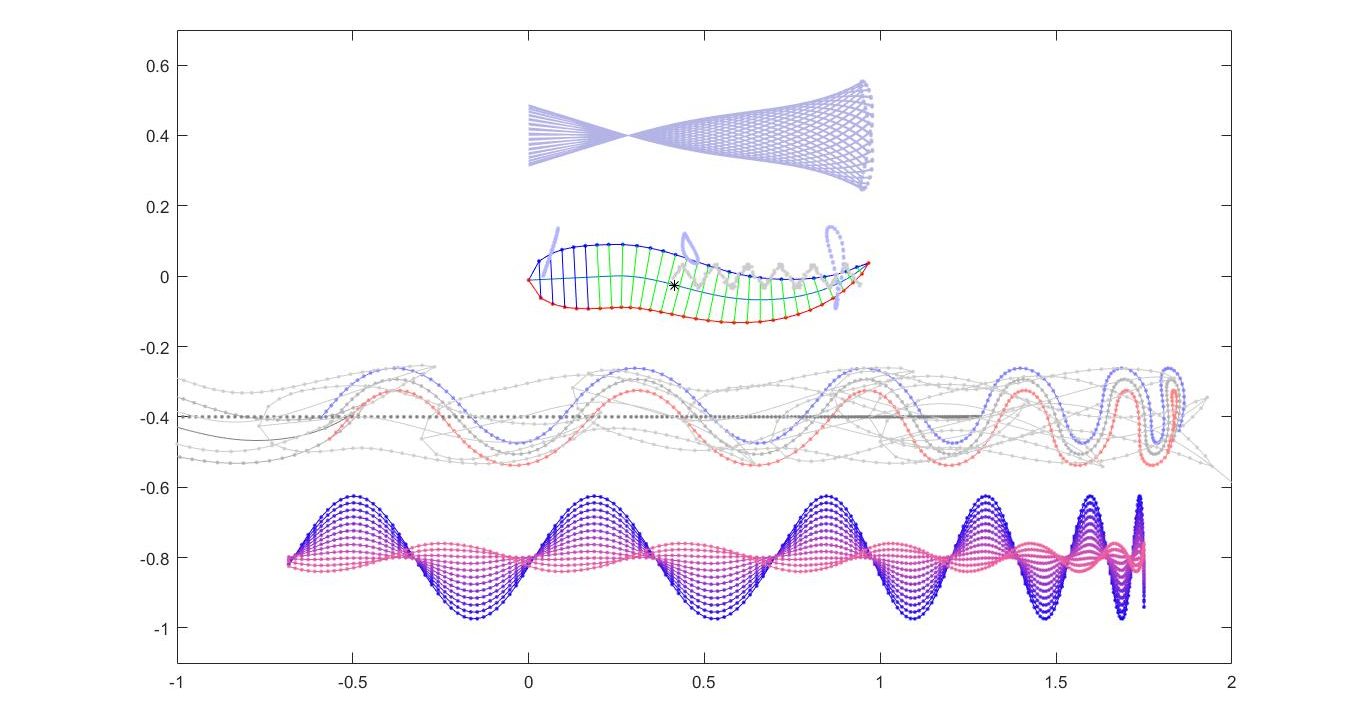
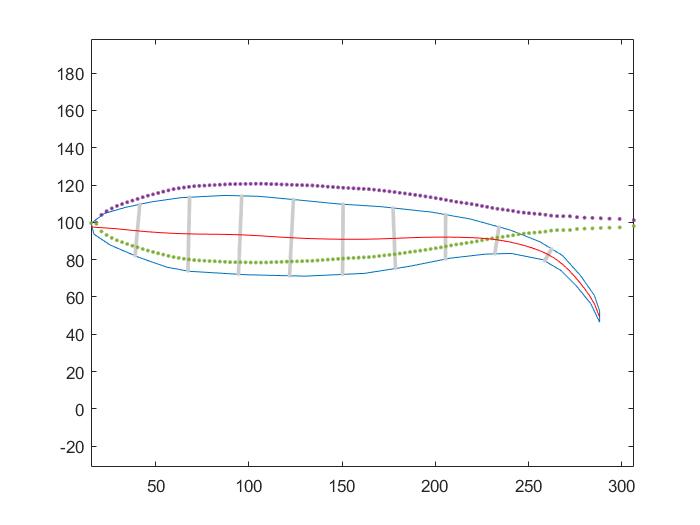
In the above image, the model fish is in the centre. The wave form of the back bone leads to the pattern above. This type of diagram is often drawn for fish observed in reality. In this case the model has a rigid head. What I found interesting was that I could track other parts of the fish – notice the black star – the centre of mass and how it moves up and down in a periodic curve (small grey curve) or other points on the fish shown as small closed grey loops (some, more toward the tail, like offset figures of 8 and at the tail it is a balanced squashed figure of 8 as can be seen in the ‘basket weave’ above). The pattern at the base of the figure shows how all the points on the fish’s side move as the fish moves along from right to left – I just added an assumed acceleration from right to left. The next line up shows how some side points near the tail would move as the fish shown as a series of grey outlines moves forward. All this stuff was new to me and interesting. But all simple enough. This looks more interesting in motion.
This is interesting as there may be a point which does not move vertically (the pivot in the basket weave picture above) – I highlighted this point that becomes a line in the video. It’s not necessarily the centre of mass (but should it be?) Then comes the next part. Each skin point can be seen as a vector moving in space – it can be decomposed into vertical and horizontal components. Then it be defined as providing thrust or drag depending on whether its movement would add thrust if this movement was resisted by water which could provide a compensatory force (horizontally forward for instance). This is a very simplistic view of a swimming fish. But it’s really fun. In the video above the lowest view of the fish shows the implied thrust and drag for the fish moving across the screen. The red dots are drag and the blue thrust and the distance away from the fish shows the magnitude. The little graph shows the implied thrust of the summation of these lateral forces (all their horizontal components). The one in the centre shows the fish without ‘moving water’. The one at the base of the figure shows how any thrust is progressively reduced until at the end only the tail is doing any thrust (this is because it is the only part moving faster than the water! – simple but interesting – well at least to me:). The graph shows how the thrust is diminished as the fish accelerates.
Does all this mean anything in real life?
So take actual pictures of swimming fish. There was a Russian scientist who wrote an unorthodox book on swimming (Nekton by Aleyev, Yu.G. (ISBN: 9789401013260) ). He put dye in fishes operculae (gill flaps) and photographed how it came streaming out as they swam. There may be ethical constraints on doing this now. So I reverse engineered the fish body shape of one of these fish – using the same method I explained above for building a fish – in reverse. 1) I traced the outer profile of the fish and 2) draw a backbone equidistant between the sides then 3) I drew rigid ribs along this backbone and then 4) using the distances between the backbone and the skin for each rib drew the shape of the fish when the ribs were all parallel with each other. See the following diagrams – first the photo then the graphic fish from this:
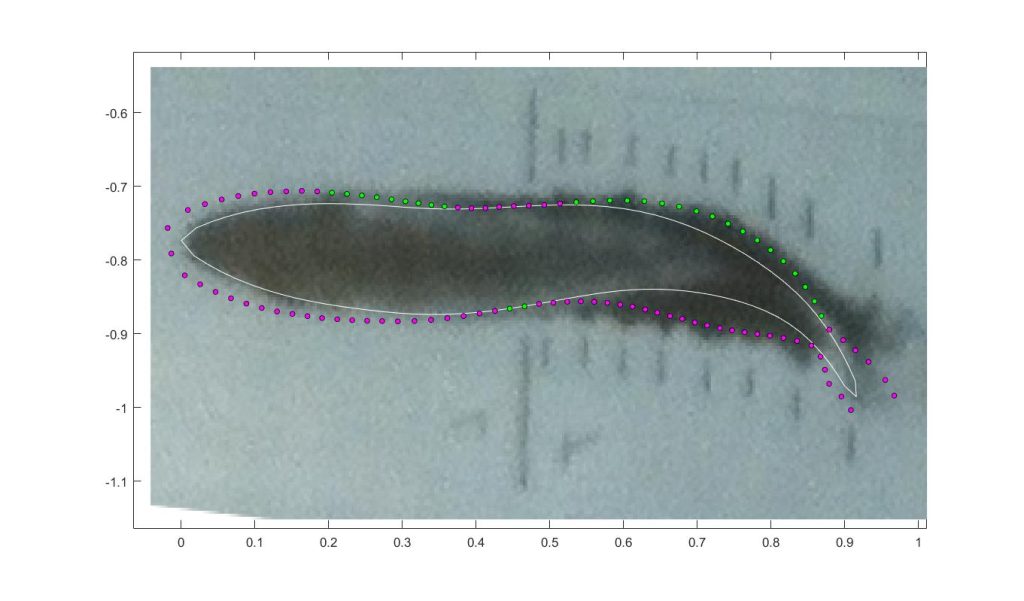
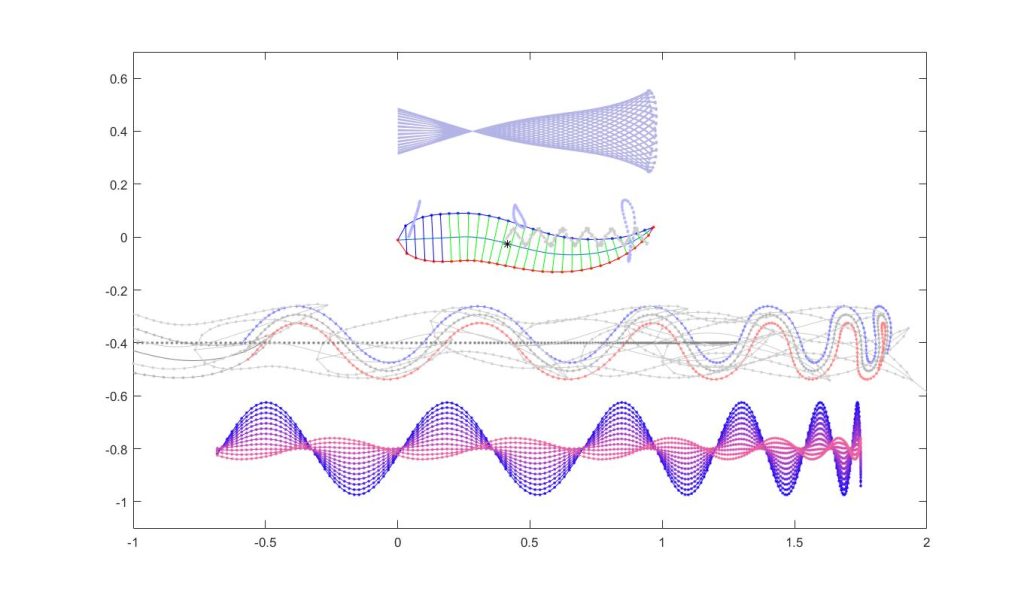
The image above was the original image from the book. The white line was my best approximation of the position of the body (forget the dots on this image for a moment). The panel below shows the reconstruction – the blue line is the original shape, the red line and the ribs can be used to make a very refined outline of the fish in its unflexed position. The purple and green dots show the sides (for 100 ribs), and the fish has been slightly rotated to be symmetrical around the x-axis. Now this fish can be put back in the model (as the shape of the model fish) and off it swims!
Then the model can be stopped just at the point where the model fish is at the same point of movement as the photo fish and the implied thrust and drag can be seen in the model. Here’s this freeze frame as it is a little difficult to see in the video above.
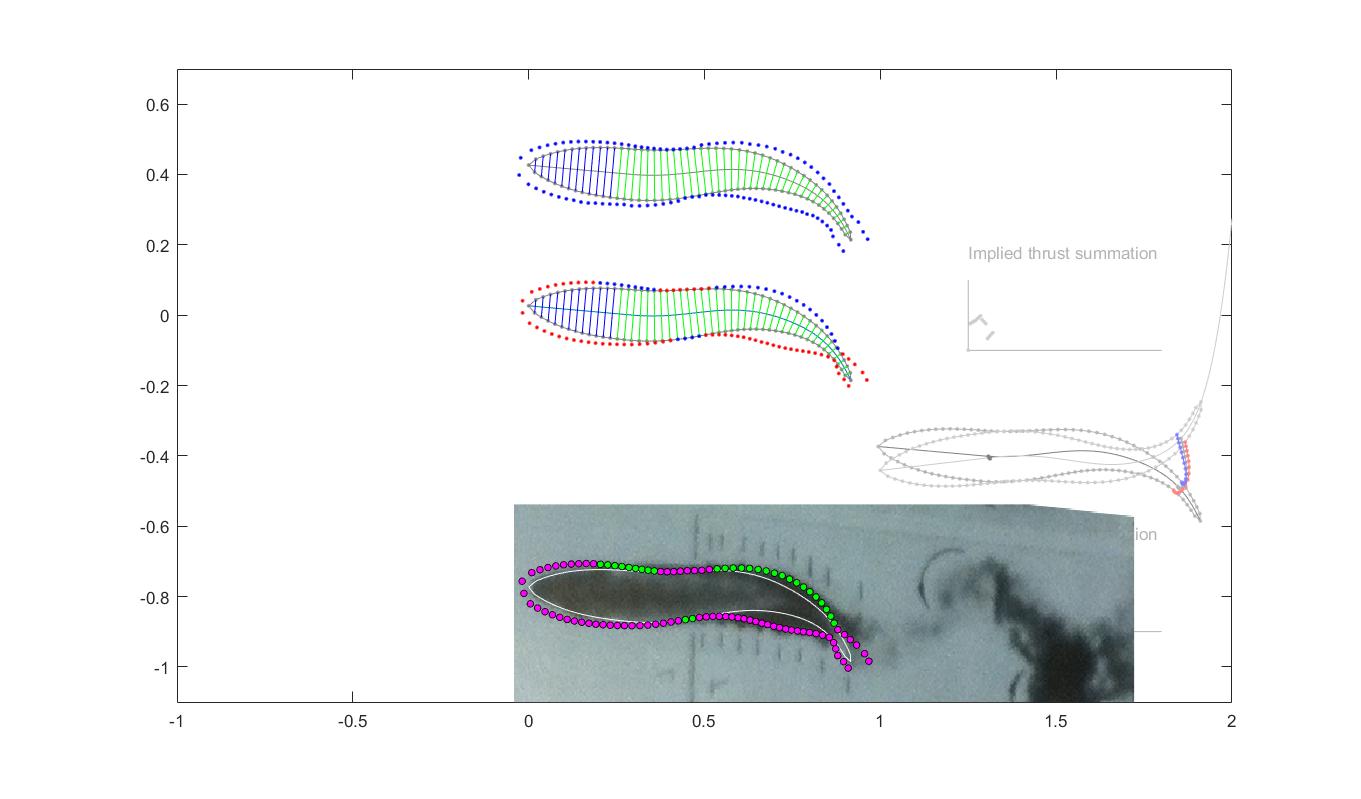
The first thing to note was that the best fit between model and photo happened immediately before any implied water movement was added. As can be seen from the photo the fish had made at least one cycle of movement before this shot. I’m not sure what this means. Most fish use a ‘C’ start to initiate movement and this might well be a factor. Nevertheless on close inspection the model and the photo show remarkable correlation. Here is a more detailed figure where the green and magenta points have been reduced to make the detail of the ink in the water more visible.
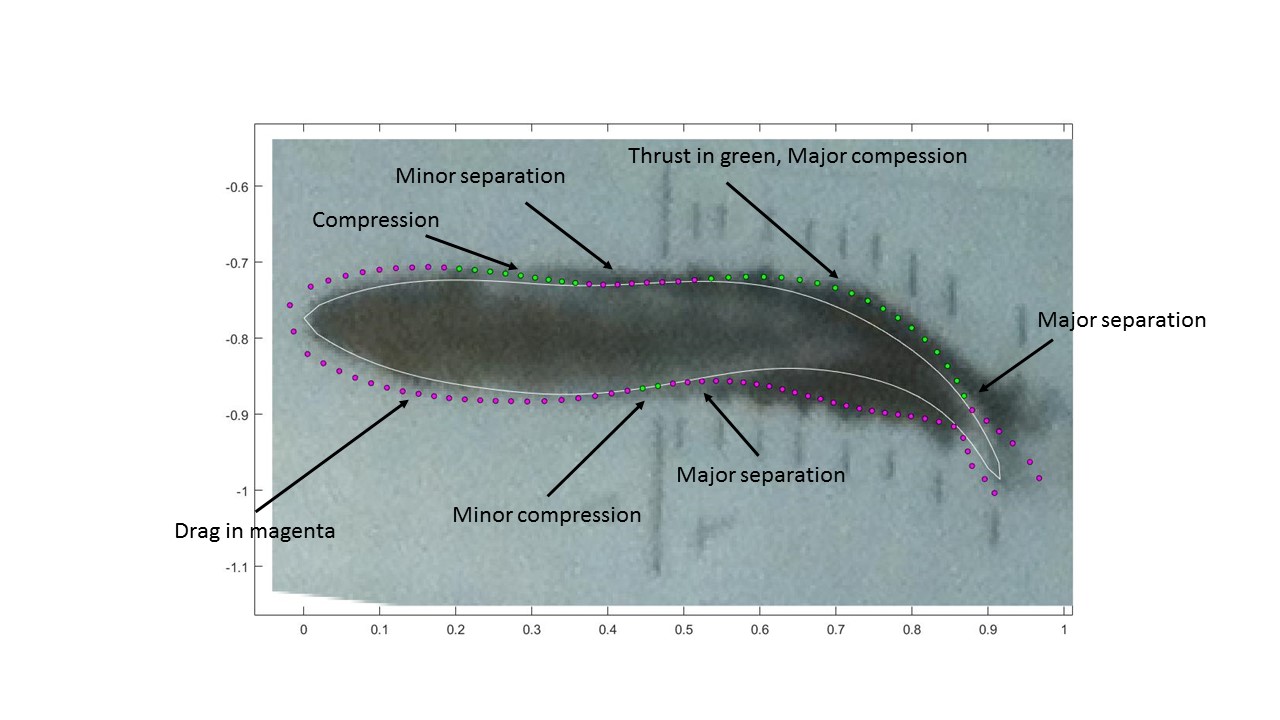
This picture shows some remarkable features – the most convincing one is at the extreme right hand side. The ink breaks away from the tail in a tiny plume exactly where the model predicts that thrust (green) changes to drag (purple). To the left of this and above it, the ink is in a zone of compression caused by the thrust as the tail begins to flex upward. Under the tail is an area where the ink is in a zone of decompression and small ripples can be seen as structured turbulent flow forms. Around the rest of the fish’s body smaller areas of compression and de-compression can be seen and are consistent with this model. I really liked all this – it helps me understand how a fish swims – perhaps. But it is entirely observational and I couldn’t pull it together for a paper in itself – it was just fun and interesting and I like the idea of going back to old observations and using models to interpret them, perhaps a little deeper than I was able to just by looking at them. As with all these things – truth is in nature. There is no truth in models, they are just aids in the process of creation of hypotheses to be falsified in designed experiments of observation of nature.